
3 Graphs Showing Why Today’s Housing Market Isn’t Like 2008 | Home Loan
Today I would like to talk to you about 3 Graphs Showing Why Today’s Housing Market Isn’t Like 2008
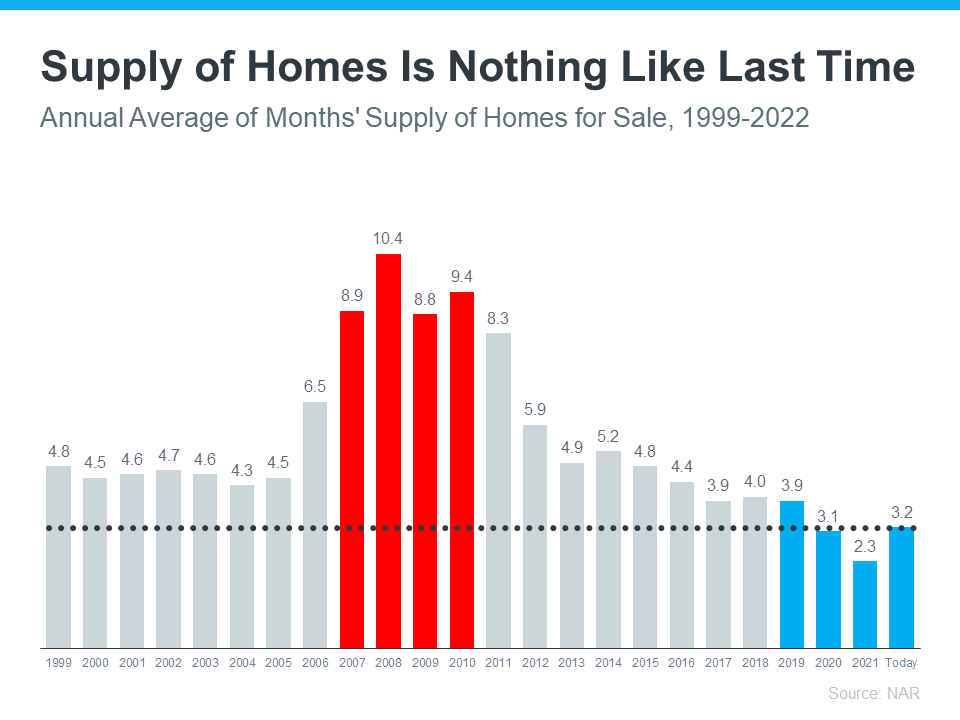
There’s Still a Shortage of Homes on the Market Today, Not a Surplus
Mortgage Standards Were Much More Relaxed Back Then
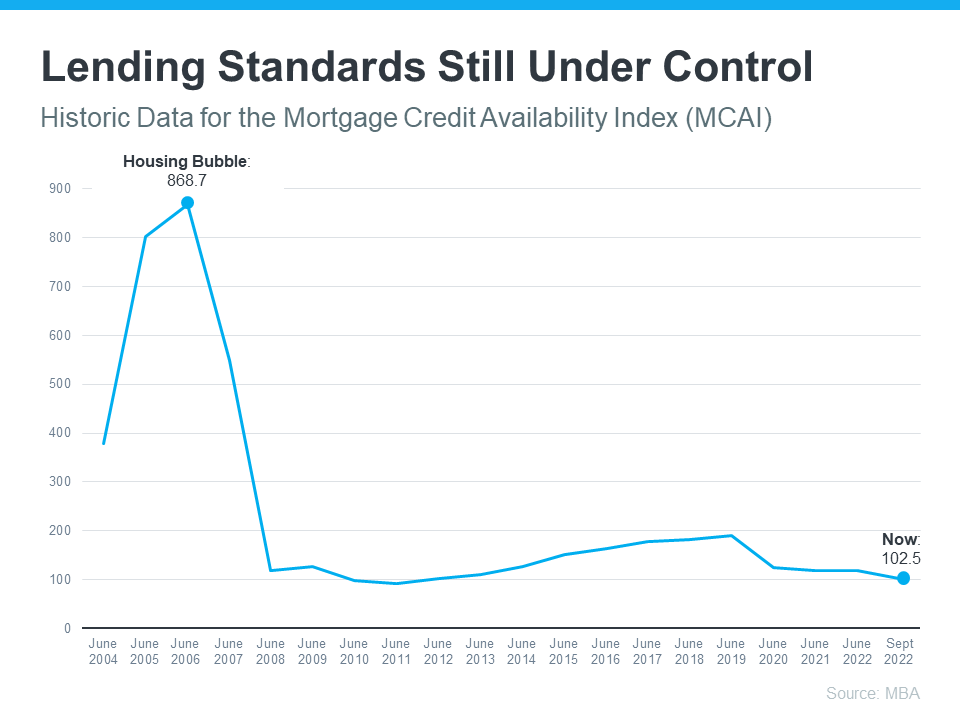
This graph also shows just how different things are today compared to the spike in credit availability leading up to the crash. Tighter lending standards over the past 14 years have helped prevent a scenario that would lead to a wave of foreclosures like the last time.
The Foreclosure Volume Is Nothing Like It Was During the Crash
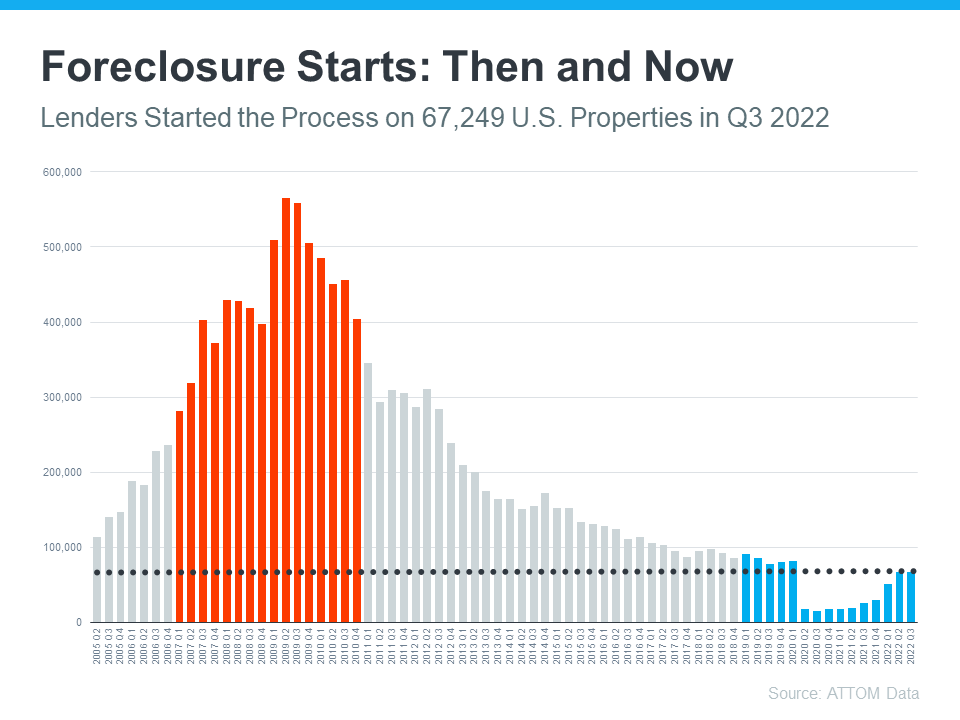
“The total average equity per borrower has now reached almost $300,000, the highest in the data series.”
“Very few of the properties entering the foreclosure process have reverted to the lender at the end of the foreclosure. . . . We believe that this may be an indication that borrowers are leveraging their equity and selling their homes rather than risking the loss of their equity in a foreclosure auction.”
Bottom Line
If you’re concerned we’re making the same mistakes that led to the housing crash, the graphs above should help alleviate your fears. Concrete data and expert insights clearly show why this is nothing like the last time.
To connect with us directly,
Please call Mike at 440-305-6349
